

Read project profitability
Quick summary: Open a billable project’s Dashboard to see its linked revenue, costs, and margin. When project budgets are enabled, the same panel also shows each related budget’s forecast and actual amount.
Open the dashboard
Section titled “Open the dashboard”- Open Project > Projects. On the project’s card, open the menu and choose Dashboard. You can also open the project and add Dashboard to its top bar.
- Confirm that the dashboard belongs to the intended project and company. If profitability is missing, check that the project is Billable, has the intended analytic account, and that your role can see project profitability.
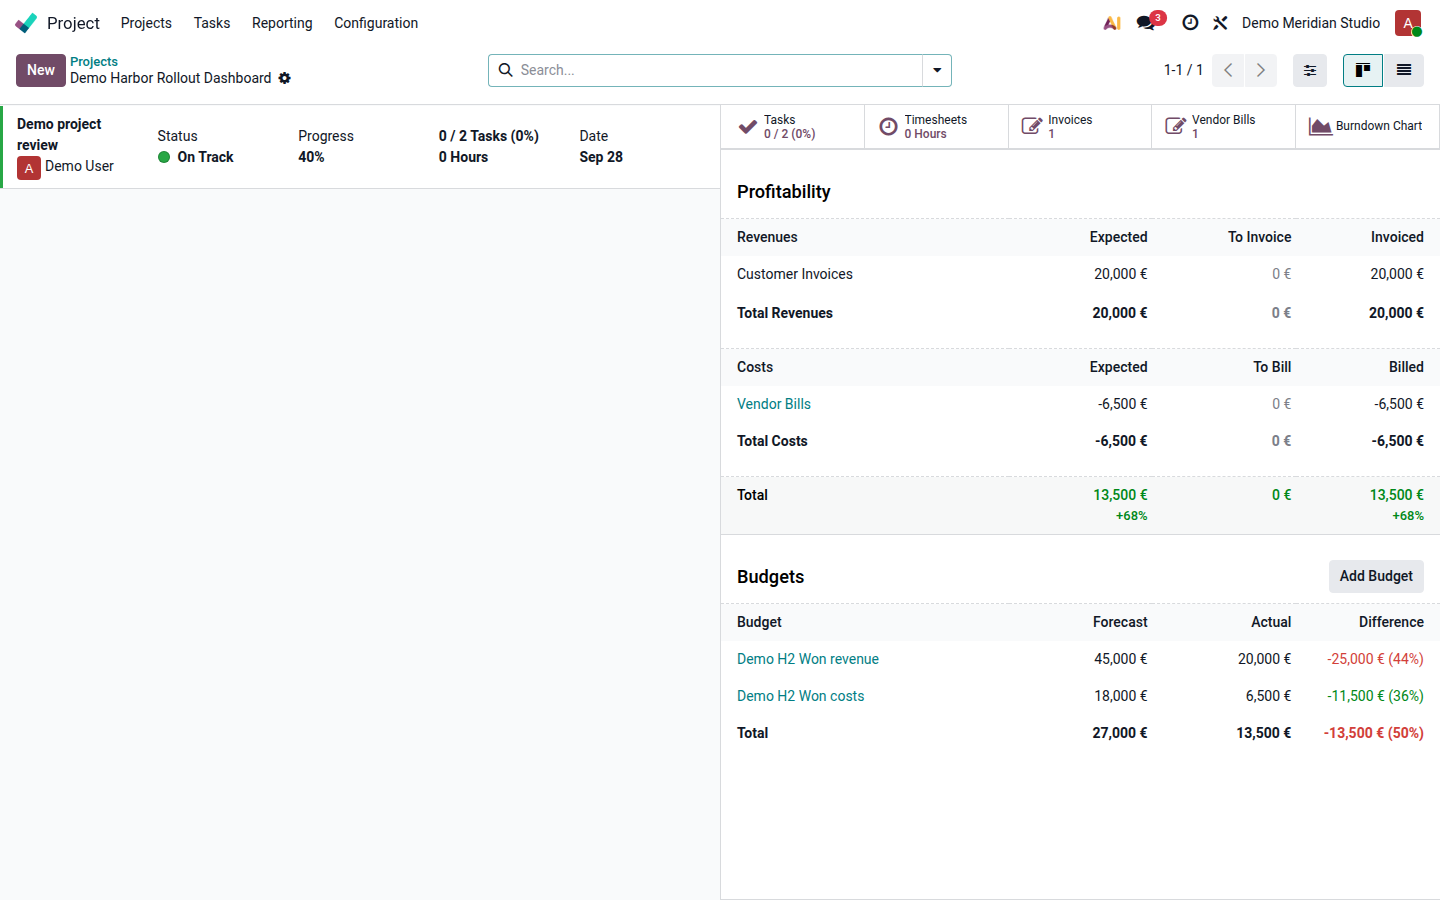
- Read Profitability on the right. Open a revenue or cost line to inspect its contributing records before using the total in a decision.
Interpret the figures
Section titled “Interpret the figures”| Section | Meaning |
|---|---|
| Revenues | Income linked to the project, such as sales, timesheets, and customer invoices. |
| Costs | Project costs such as timesheets, vendor bills, materials, and expenses. Costs reduce the margin. |
| Expected | Amount expected from the linked commercial and accounting records. It is not the CRM opportunity’s unconfirmed estimate. |
| To Invoice / To Bill | Delivered work or costs that have not yet reached the posted customer invoice or vendor bill column. |
| Invoiced / Billed | Revenue and costs on posted customer invoices and vendor bills. |
The same work can appear on both sides: a billable timesheet may contribute customer revenue and employee cost. Drill into the source lines to check its invoicing policy, date, analytic account, and posting state. A missing analytic assignment can leave a real cost out of the project view.
In the example, the project has €20,000 invoiced revenue and €6,500 billed costs. Its realized margin is €13,500 (€20,000 − €6,500), or 68% of revenue. These figures describe the linked project records; they do not automatically include a separate potential opportunity.
Read the budget section
Section titled “Read the budget section”When Budgets is visible, Forecast is the planned amount, Actual is the achieved amount, and Difference compares them. The example has €45,000 planned revenue and €18,000 planned costs, leaving a €27,000 planned margin. Actual revenue of €20,000 less actual costs of €6,500 leaves €13,500.
If the figures do not agree, check project links, analytic distributions, dates, posting status, and budget revisions. Leave time and cost entries on a lost project’s original account; report unsuccessful bids separately instead of moving their history onto a won project.